top of page

Intracerebroventricular bivalent CAR T cells targeting EGFR and IL-13Rα2 in recurrent glioblastoma: a phase 1 trial

11월 2일
4분 분량

Stephen J Bagley 1 2 3, Arati S Desai 4 5 6, Joseph A Fraietta 7 8, Dana Silverbush 9, Daniel Chafamo 6, Nelson F Freeburg 9, Gayathri Konanur Gopikrishna 9, Andrew J Rech 7 10, Ali Nabavizadeh 11, Linda J Bagley 6 11, Jungmin Park 5 6 7, Danuta Jarocha 7, Rene Martins 7, Nicolas Sarmiento 7, Eileen Maloney 5 6, Lester Lledo 7, Carly Stein 7, Amy Marshall 7, Rachel M Leskowitz 7, Julie K Jadlowsky 7, Shane Mackey 7, Shannon Christensen 7, Bike Su Oner 7, Gabriela Plesa 7, Andrea Brennan 7, Vanessa Gonzalez 7, Fang Chen 7, David Barrett 12, Robert Colbourn 10, MacLean P Nasrallah 5 10, Zissimos Mourelatos 10, Wei-Ting Hwang 13, Cecile Alanio 14 15, Donald L Siegel 5 7 10, Carl H June 7 10, Elizabeth O Hexner 4 7, Zev A Binder 5 6 7, Donald M O'Rourke 16 17 18PMID: 40451950          PMCID: PMC12715680                 DOI: 10.1038/s41591-025-03745-0


Abstract

Glioblastoma (GBM) is the most common primary brain cancer in adults and carries a median overall survival (OS) of 12-15 months. Effective therapy for recurrent GBM (rGBM) following frontline chemoradiation is a major unmet medical need. Here we report the dose escalation and exploration phases of a phase 1 trial investigating intracerebroventricular delivery of bivalent chimeric antigen receptor (CAR) T cells targeting epidermal growth factor receptor (EGFR) epitope 806 and interleukin-13 receptor alpha 2 (IL-13Rα2), or CART-EGFR-IL13Rα2 cells, in patients with EGFR-amplified rGBM. Primary endpoints included dose-limiting toxicity, determination of the maximum tolerated dose and recommended dose for expansion, and occurrence of adverse events. Secondary endpoints included objective radiographic response, duration of response, progression-free survival and OS. A total of 18 patients received CART-EGFR-IL13Rα2 cells. The maximum tolerated dose was determined to be 2.5 × 10⁷ cells. Of the 18 patients, 10 (56%) experienced grade 3 neurotoxicity; none had grade 4-5 neurotoxicity. Of 13 patients, 8 (62%) with measurable disease at the time of CAR T cell infusion experienced tumor regression, with one confirmed partial response by Modified Response Assessment in Neuro-Oncology criteria (objective radiographic response, 8%; 90% confidence interval, 0-32%) and one patient with ongoing durable stable disease lasting over 16 months. Median progression-free survival was 1.9 months (90% confidence interval, 1.1-3.4 months), and median OS was not yet reached at the time of data cut-off (median follow-up time, 8.1 months). These findings indicate that intracerebroventricular delivery of bivalent CART-EGFR-IL13Rα2 is feasible and appears safe. CART-EGFR-IL13Rα2 cells are bioactive and exhibit a signal of antitumor effect in rGBM. ClinicalTrials.gov registration: NCT05168423 .

① 연구 배경

·         교모세포종(GBM): 성인에서 가장 흔한 원발성 뇌암

·         중앙 전체생존기간(mOS): 12~15개월

·         초기 항암방사선 치료 후 재발성 교모세포종(rGBM): 효과적인 치료법이 부족한 미충족 의료 수요(unmet medical need)

② 연구 목적 및 방법

·         연구 단계: 1상 임상시험

·         연구 대상: EGFR 증폭이 확인된 재발성 교모세포종 환자

·         치료 방법: 이중 표적 CAR-T 세포 뇌실 내 투여(ICV)

·         표적 항원: EGFR epitope 806 및 IL-13Rα2

·         치료제: CART-EGFR-IL13Rα2

③ 평가변수

일차 평가변수

·         용량제한독성(DLT)

·         최대내약용량(MTD) 결정

·         용량 확장 단계 권장 용량(RDE) 결정

·         이상사례(AE) 발생 여부

이차 평가변수

·         객관적 영상학적 반응률(ORR)

·         반응 지속기간(DoR)

·         무진행생존기간(PFS)

·         전체생존기간(OS)

④ 연구 결과

·         총 투여 환자: 18명

·         최대내약용량(MTD): 2.5 × 10⁷ cells

·         3등급 신경독성: 10명(56%)

·         4~5등급 신경독성: 0명

·         측정 가능한 종양 보유 환자: 13명

·         종양 퇴행(tumor regression): 8명(62%)

·         객관적 반응률(ORR): 8% (부분관해 1명)

·         장기간 안정병변(SD): 1명(16개월 이상 지속)

·         중앙 무진행생존기간(mPFS): 1.9개월

·         중앙 전체생존기간(mOS): 미도달

·         중앙 추적관찰 기간: 8.1개월

⑤ 연구 결론

·         뇌실 내 CAR-T 세포 투여의 임상적 실행 가능성 확인

·         4~5등급 신경독성 미발생

·         CAR-T 세포의 생물학적 활성 확인

·         종양 퇴행을 통한 항종양 효과 가능성 확인

·         재발성 교모세포종 치료 효과에 대한 추가 임상연구 필요

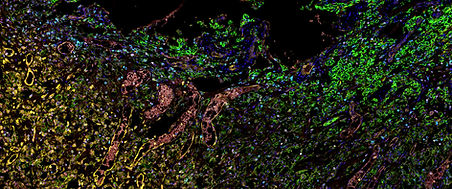
Fig. 4: Efficacy measures.                                                                                                                                                                                                                     a, Waterfall plot (n = 13 patients with measurable disease at time of CAR T cell infusion) depicting best tumor regression compared with the baseline and present at the day +28 MRI scan and/or later timepoints (DL −1, dose level −1; DL1, dose level 1; DL2, dose level 2). b, Swimmer plot (n = 18) depicting patient survival. c, T1 post-contrast MRI images for patient 28, who experienced a confirmed partial response by mRANO criteria, and patient 26, who experienced marked tumor regression of a large enhancing tumor in the splenium of the corpus callosum but had tumor progression 1 month later. d, PFS (n = 18). e, PFS in patients treated in dose level −1 (5.0 × 106 cells, n = 6) versus patients treated in dose levels 1 and 2 (1.0 × 107 cells and 2.5 × 107 cells, respectively; n = 12). Two-sided log-rank P = 0.15 (no adjustment for multiple comparisons). f, Pre- and post-CAR T cell histology for patient 52, who experienced radiographic progression and underwent repeat craniotomy for tumor resection on day +117 following infusion of 5.0 × 106 CAR T cells. Before CAR T cell infusion, the histology showed recurrent glioma and reactive changes as well as areas of necrosis consistent with radiation-related changes. Activated microglia and macrophages are highlighted by a CD163 stain. By contrast, in the post-infusion specimen, macrophages have epithelioid foamy cytology and are packed with GFAP+ material. The macrophages are present in sheets where the tumor has been obliterated and in pools within the recurrent tumor. The areas with macrophages are rich in CD8+ T cells, which are also scattered in the tumor. GFAP is positive in the glial areas, but also positive in the macrophages, indicative of the macrophage clearance activity. The foamy macrophages and their GFAP+ content are shown at higher power in the three lowest images. An area of gliotic parenchyma with infiltrating tumor in the lower right allows differentiation of the CD68 and GFAP stains. A 50-μm-wide inset shows a single cell in the GFAP image. Staining was performed once on these specimens and not repeated.
Fig. 4: Efficacy measures. a, Waterfall plot (n = 13 patients with measurable disease at time of CAR T cell infusion) depicting best tumor regression compared with the baseline and present at the day +28 MRI scan and/or later timepoints (DL −1, dose level −1; DL1, dose level 1; DL2, dose level 2). b, Swimmer plot (n = 18) depicting patient survival. c, T1 post-contrast MRI images for patient 28, who experienced a confirmed partial response by mRANO criteria, and patient 26, who experienced marked tumor regression of a large enhancing tumor in the splenium of the corpus callosum but had tumor progression 1 month later. d, PFS (n = 18). e, PFS in patients treated in dose level −1 (5.0 × 106 cells, n = 6) versus patients treated in dose levels 1 and 2 (1.0 × 107 cells and 2.5 × 107 cells, respectively; n = 12). Two-sided log-rank P = 0.15 (no adjustment for multiple comparisons). f, Pre- and post-CAR T cell histology for patient 52, who experienced radiographic progression and underwent repeat craniotomy for tumor resection on day +117 following infusion of 5.0 × 106 CAR T cells. Before CAR T cell infusion, the histology showed recurrent glioma and reactive changes as well as areas of necrosis consistent with radiation-related changes. Activated microglia and macrophages are highlighted by a CD163 stain. By contrast, in the post-infusion specimen, macrophages have epithelioid foamy cytology and are packed with GFAP+ material. The macrophages are present in sheets where the tumor has been obliterated and in pools within the recurrent tumor. The areas with macrophages are rich in CD8+ T cells, which are also scattered in the tumor. GFAP is positive in the glial areas, but also positive in the macrophages, indicative of the macrophage clearance activity. The foamy macrophages and their GFAP+ content are shown at higher power in the three lowest images. An area of gliotic parenchyma with infiltrating tumor in the lower right allows differentiation of the CD68 and GFAP stains. A 50-μm-wide inset shows a single cell in the GFAP image. Staining was performed once on these specimens and not repeated.


댓글


AMC NS LAB
서울아산병원 신경외과 중환자실, 신경외과연구실, NSICU
© 2024 by NSLAB Hanwool Jeon, Hayeong Kang

bottom of page